
It’s time for a big wake up call. Education leaders have a tendency to report the “easy” metrics. After all, we are a business within a business, so we typically report:
- Training Revenue
- Training Margin
- Number of Students Trained
- Number of Courses Added and Revised
- Number of Online Courses Completed
Consider what keeps your executives up at night:
- Cost to acquire a new customer
- Logo churn (accounts that do not renew)
- Dollar churn (accounts that renew at a lower dollar amount)
- Expanding the business within an existing account (land and expand)
- Time to initial value (particularly important when software is sold using a subscription model)
The obvious question is, what is the true impact of the training organization on business results? And yet, too few training leaders are measuring the impact they have beyond the “easy” metrics described above.
Here are some starting points that might get you on the road to measuring the impact of training on business results (however indirect that impact may be). Try not to get hung up on details – you can always improve the accuracy of your metrics as you define what it means to be a “well trained” customer vs. simply a customer who took at least some training.
 Note: All of the example metrics in this Blog are illustrative only and do not reflect the actual business results at Black Duck Software or any other company.
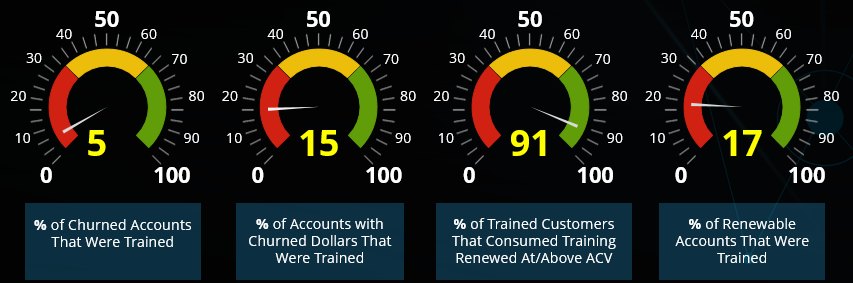
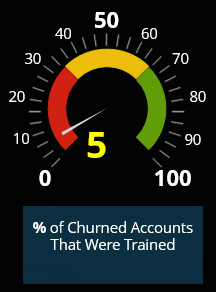
- Start simple! Calculate the percentage of accounts that churned (no renewal) last quarter that were trained in the last 12 months. It’s pretty likely that a VERY small percentage of these accounts consumed training. Put this metric in front of your VP of Sales and your VP of Customer Success to make the case to include training on every new deal.
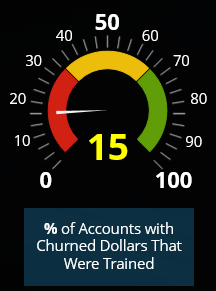
- Next, look at accounts that renewed last quarter at a LOWER dollar amount than planned who were trained in the last 12 months. Again, it’s likely that accounts where you are losing ACV are not consuming much (if any training). Put this metric in front of your VP of Customer Success and your CFO, when you are making the business case for more training resources.
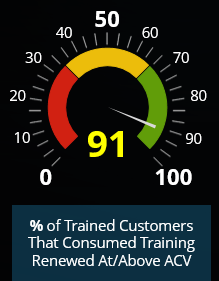
- Now, look at the positive result of renewed customers who were trained. What percentage of trained customers renewed at or above the planned ACV last quarter? We want to make the case that training makes an impact in the dollar amount of the renewal. Be careful here, you want to laser focus on the group of renewed customers that were trained in the last quarter. Now look at the renewal dollars and count the number of those trained customers who renewed at or above the planned ACV vs. those that renewed at a lower dollar amount. It’s likely that a very high percentage of those trained customers renewed at or even ABOVE the planned ACV.
- Finally, it’s likely that your attach rates for training are not what they should be. So once you’ve made the case that:
- The vast majority of untrained customers will churn
- The vast majority of untrained customers will churn dollar value
- Trained customers frequently renew at or above the planned ACV
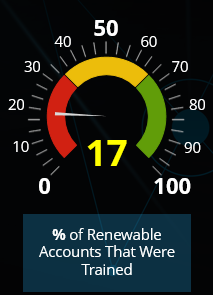
Focus in on making the case that you are not attaching enough training to your deals. A simple calculation for example is the % of renewal eligible customers last quarter who were trained over the last 12 months. Hopefully, this is the money slide that you put in front of your VP of Sales to get her support to drive up training attach rates.
CONCLUSION:
This is just the tip of the iceberg. There are so many metrics that you might consider measuring to show the impact of training on your business. Some additional ideas to consider:
- Do trained customers on-board faster than untrained customers?
- Do trained customers achieve initial value with your solution faster than untrained customers?
- Do certified customers move the needle more than customers that simply consume training?
- Do trained customers submit fewer “how-to” cases to your support team?
- If you measure Net Promoter Score (NPS), can you calculate the NPS score of trained customers and compare it to the NPS score of untrained customers?
Putting all of this in context for a moment, training is of course not the ONLY factor that contributes to business results. So make sure you consider how your training measures fit along-side other critical customer health metrics such as product usage (increasing or decreasing?), time-to-go-live, # of open support cases, # of support case escalations, etc..
If you are interested in measuring the impact of your training organization on your business results, consider joining CEdMA where you will have access to the vast experience of hundreds of customer-facing education managers at technology companies via forums, conferences, webinars, metrics and much more.